

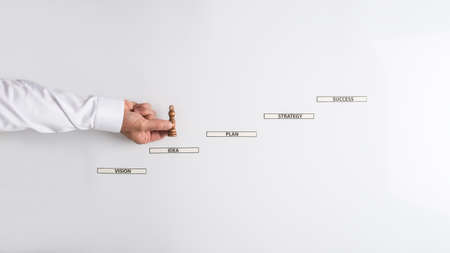
Market segmentation and targeting concept. Color figures on the desk.
Коллекция по умолчанию
Коллекция по умолчанию
Создать новую

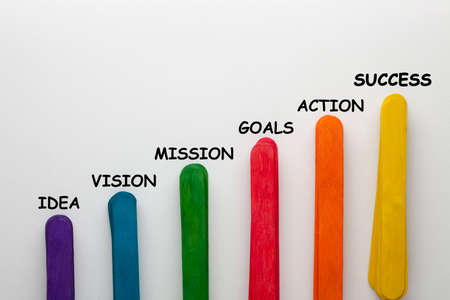
Wood bar block or yellow and black colour with line around. Top view
Коллекция по умолчанию
Коллекция по умолчанию
Создать новую

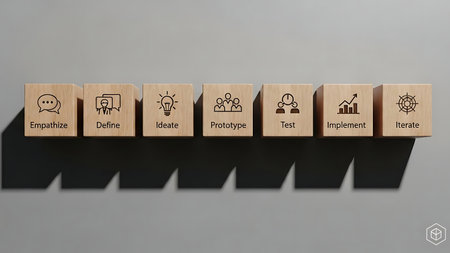
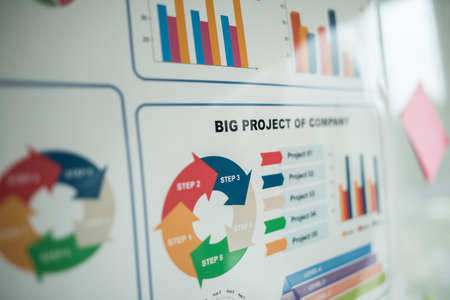
Process on wooden blocks. Motivation and inspiration concept. Cross processed image
Коллекция по умолчанию
Коллекция по умолчанию
Создать новую

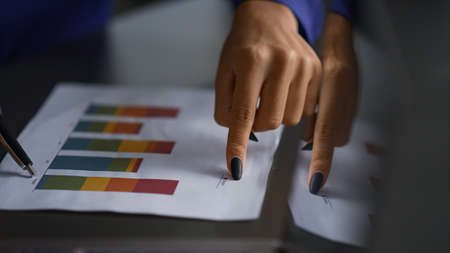
Child's hand arranging wood blocks in a step stair concept. Concept for growth, strategy, success process or investment goals.
Коллекция по умолчанию
Коллекция по умолчанию
Создать новую

A colorful wooden block with an arrangement of stair or graph.
Коллекция по умолчанию
Коллекция по умолчанию
Создать новую

Progress message written on wooden blocks. education and motivation concepts. Cross processed image on Wooden Background
Коллекция по умолчанию
Коллекция по умолчанию
Создать новую
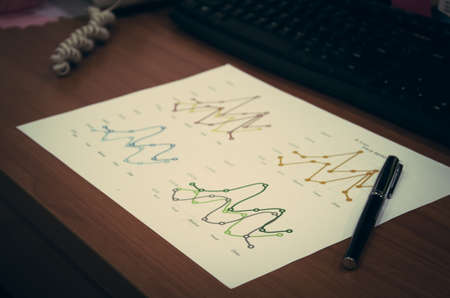
Line graph on desk and pen. Vintage filter
Коллекция по умолчанию
Коллекция по умолчанию
Создать новую
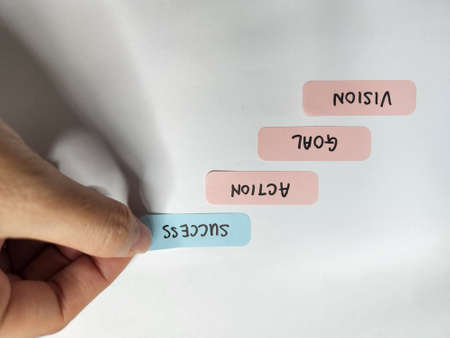
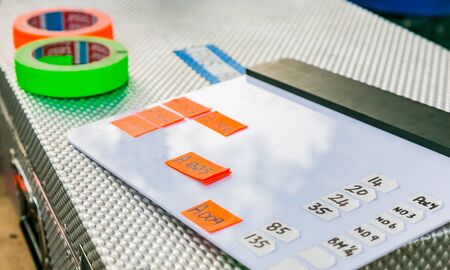
Hand holding a sticky note on the whiteboard with text. Inspiration concept.
Коллекция по умолчанию
Коллекция по умолчанию
Создать новую

Statistical financial graph predicting an economic depression after a 2020 global coronavirus pandemic.
Коллекция по умолчанию
Коллекция по умолчанию
Создать новую

Colorful sticky notes scattered on a dark surface represent brainstorming and organization in a modern office setting, showcasing creativity and collaborative planning.
Коллекция по умолчанию
Коллекция по умолчанию
Создать новую

Team work with results and reports
Коллекция по умолчанию
Коллекция по умолчанию
Создать новую

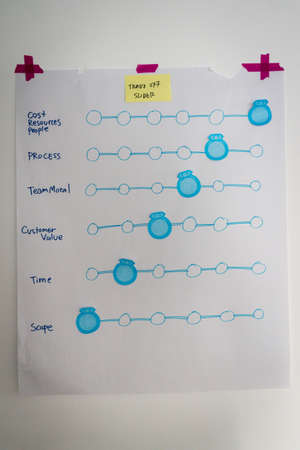
Chalkboard with ladder made of wooden blocks arrows up. Increase, rise, grow up. Business statistic. Career, money, success. Financial progress step by step on stacking blocks. Business flat lay.
Коллекция по умолчанию
Коллекция по умолчанию
Создать новую

A bar chart displaying quarterly revenue growth for a successful business, with colorful bars rising high.
Коллекция по умолчанию
Коллекция по умолчанию
Создать новую

Hand putting and stacking blank wooden cubes on table with copy space for input wording and infographic icon.
Коллекция по умолчанию
Коллекция по умолчанию
Создать новую
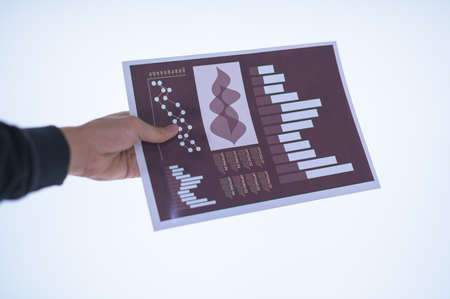
An AI generated illustration of project management graphs charts paper
Коллекция по умолчанию
Коллекция по умолчанию
Создать новую

Hand stacking colorful wooden blocks into rising bar graph
Коллекция по умолчанию
Коллекция по умолчанию
Создать новую

Colorful wooden blocks in a row on the background of a graph
Коллекция по умолчанию
Коллекция по умолчанию
Создать новую

Colorful wooden blocks on the table in the office, business concept
Коллекция по умолчанию
Коллекция по умолчанию
Создать новую

A visually engaging workspace featuring colorful push pins and sticky notes on graph paper, illustrating data representation and enhancing creative organization for projects.
Коллекция по умолчанию
Коллекция по умолчанию
Создать новую

blocks of wood and colors showing different steps and scales
Коллекция по умолчанию
Коллекция по умолчанию
Создать новую

Hand putting wooden cube on virtual infographic rectangleblock with progress wording. Job progressive concept.
Коллекция по умолчанию
Коллекция по умолчанию
Создать новую
Startup paperwork on the wall
Коллекция по умолчанию
Коллекция по умолчанию
Создать новую
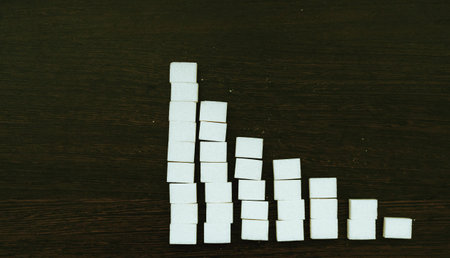
Sugar cubes are stacked in a column in an increasing direction on a dark background. Harmful to health. Diabetes.
Коллекция по умолчанию
Коллекция по умолчанию
Создать новую

Colorful wooden blocks stacking as step stair. Business growth concept.
Коллекция по умолчанию
Коллекция по умолчанию
Создать новую
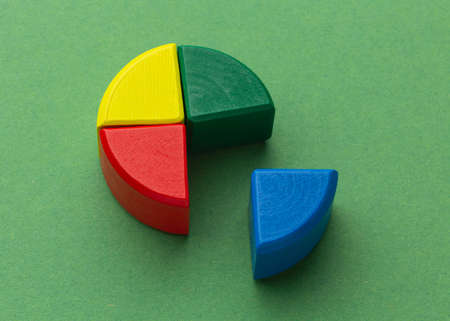
Stats concept with wood pie chart
Коллекция по умолчанию
Коллекция по умолчанию
Создать новую

The elapsed time in the allotted period. Meet goals before time runs out. Deadlines, project timelines, and countdowns.
Коллекция по умолчанию
Коллекция по умолчанию
Создать новую
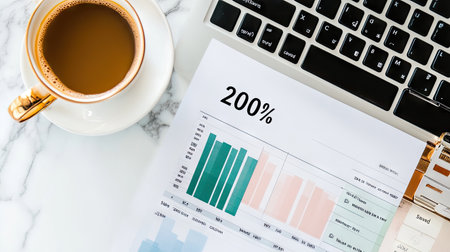
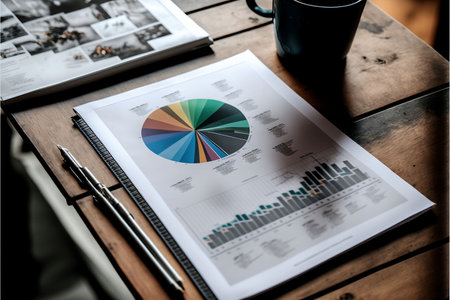
A modern workspace scene featuring a cup of coffee beside a laptop, with charts and graphs showcasing data analysis for productivity and business growth.
Коллекция по умолчанию
Коллекция по умолчанию
Создать новую

Business graph diagram with multicolored bars with rise dynamic against blue background
Коллекция по умолчанию
Коллекция по умолчанию
Создать новую

3d render graph over gray background, rainbow business infographic, panoramic layout
Коллекция по умолчанию
Коллекция по умолчанию
Создать новую

A detailed diagram illustrates project management strategies with colorful nodes and connections, symbolizing teamwork and effective planning in a business environment.
Коллекция по умолчанию
Коллекция по умолчанию
Создать новую

Close up image of colored wooden blocks as a graph
Коллекция по умолчанию
Коллекция по умолчанию
Создать новую
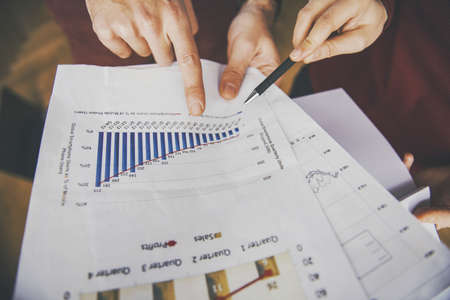
Business woman hands analyze diagram graph show financial charts information in office table. Close up female executive explaining presenting marketing data on conference. Corporate analysis concept.
Коллекция по умолчанию
Коллекция по умолчанию
Создать новую

Construction of wooden cubes on blue background with copy space. Mockup composition for design.
Коллекция по умолчанию
Коллекция по умолчанию
Создать новую

A vibrant bar chart displayed on a dark surface, showcasing data analysis and statistical trends, ideal for business presentations and reports.
Коллекция по умолчанию
Коллекция по умолчанию
Создать новую

Colorful fraction circles arranged into a circle graph and hand, black background.
Коллекция по умолчанию
Коллекция по умолчанию
Создать новую
Wooden blocks with business icons on grey background. Concept of teamwork.
Коллекция по умолчанию
Коллекция по умолчанию
Создать новую

Sales growth and development illustrated on a graph
Коллекция по умолчанию
Коллекция по умолчанию
Создать новую

Process write on sticky notes and step task checklist isolated on the table.
Коллекция по умолчанию
Коллекция по умолчанию
Создать новую

A vibrant bar graph adorned with colorful sticky notes showcases data trends in a modern office setting. The image captures the essence of collaboration and creativity, highlighting the dynamic process of analyzing and presenting information.
Коллекция по умолчанию
Коллекция по умолчанию
Создать новую

This vibrant image showcases colorful paper cutouts arranged strategically on a dark background, symbolizing project planning and workflow processes.
Коллекция по умолчанию
Коллекция по умолчанию
Создать новую

Close-up of a stock market analysis chart with a mix of bar graphs and line graphs highlighting key data
Коллекция по умолчанию
Коллекция по умолчанию
Создать новую

Graph of market share with black pen in business concept
Коллекция по умолчанию
Коллекция по умолчанию
Создать новую

paper card with diagrams, dollar sign and gearwheel drawing pinned on cork office board
Коллекция по умолчанию
Коллекция по умолчанию
Создать новую

Businesswoman holding a notepad at her desk, a group of businessmen attending a meeting and holding meeting materials, brainstorming meeting to plan a company's growth. Business meeting idea.
Коллекция по умолчанию
Коллекция по умолчанию
Создать новую

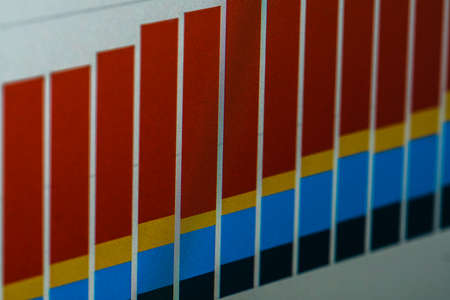
Colored sticker stripes on business analytics chart closeup
Коллекция по умолчанию
Коллекция по умолчанию
Создать новую

Diverse hands actively participate in a collaborative brainstorming session, charting ideas and strategies on a large paper, surrounded by colorful sticky notes.
Коллекция по умолчанию
Коллекция по умолчанию
Создать новую

Shallow depth of field (selective focus) with details of a chart showing the stock market crash from March 2020 due to the Covid-19 pandemic on a computer screen (S&P500 index)
Коллекция по умолчанию
Коллекция по умолчанию
Создать новую

Going up concept using stairway of wood blocks.
Коллекция по умолчанию
Коллекция по умолчанию
Создать новую

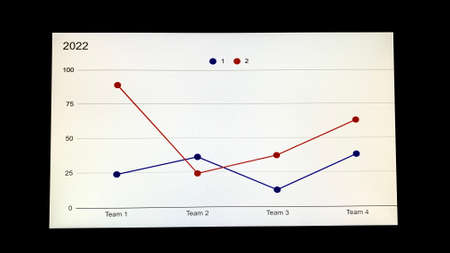
A piece of paper with a graph on it is on a table. The graph is a bar chart with a red and blue line. The paper is crumpled and has a few creases
Коллекция по умолчанию
Коллекция по умолчанию
Создать новую

Analysis of data from graphs. select focus.
Коллекция по умолчанию
Коллекция по умолчанию
Создать новую

Business plan documents and charts for eco-tourism startup on rustic wooden table
Коллекция по умолчанию
Коллекция по умолчанию
Создать новую
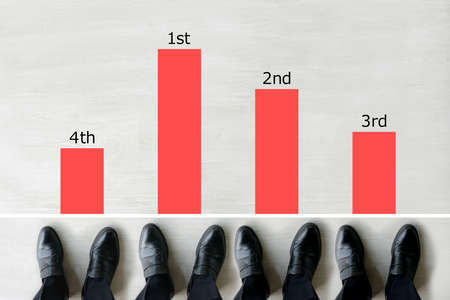
Image of businessman's business performance and annual income graph and ranking
Коллекция по умолчанию
Коллекция по умолчанию
Создать новую
Clapperboard on location used on television and film set productions
Коллекция по умолчанию
Коллекция по умолчанию
Создать новую

Wooden blocks displaying business growth icons, financial savings symbols, a target goal, the year 2026, representing future planning, economic strategy, investment forecasting, long-term objectives.
Коллекция по умолчанию
Коллекция по умолчанию
Создать новую

A vibrant display of pastel color swatches arranged on a light background, ideal for exploring color combinations and creative design concepts. Perfect for artists and designers.
Коллекция по умолчанию
Коллекция по умолчанию
Создать новую
Businessman hand holding a document. Scenes white background.
Коллекция по умолчанию
Коллекция по умолчанию
Создать новую

Annual business report. Accountability paperwork. Hands holding a heap of documents with graphs and statistics
Коллекция по умолчанию
Коллекция по умолчанию
Создать новую

working economist financial analytics papers
Коллекция по умолчанию
Коллекция по умолчанию
Создать новую

Creative bar graph made from colorful blocks, set against a white minimalist background
Коллекция по умолчанию
Коллекция по умолчанию
Создать новую

Many type of infographic diagram over white background. Top view.
Коллекция по умолчанию
Коллекция по умолчанию
Создать новую

This image showcases a colorful graphical representation of data on a wooden table. The cylindrical objects illustrate various metrics and trends, emphasizing creativity and clarity in business analysis.
Коллекция по умолчанию
Коллекция по умолчанию
Создать новую

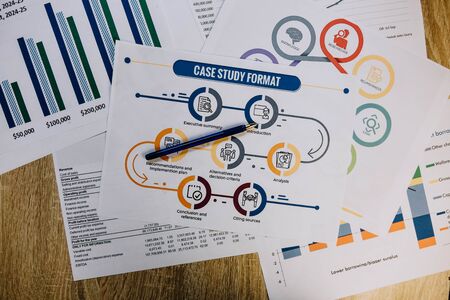
A top-down view of a business strategy flowchart laid out on a cardboard sheet, surrounded by US dollars, coins, a vintage camera, and pens.
Коллекция по умолчанию
Коллекция по умолчанию
Создать новую

Taking Step to Improve Communication write on a book isolated on wooden table.
Коллекция по умолчанию
Коллекция по умолчанию
Создать новую
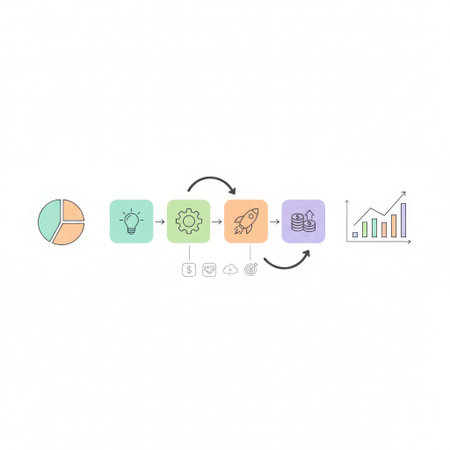
A minimalist infographic illustrating a business or startup lifecycle process. The flow begins with a pie chart representing initial data analysis or planning. It progresses through four key stages represented by icons: a lightbulb for idea generation, a gear for development and process implementation, a rocket for product launch or startup acceleration, and stacked coins for investment and financial growth. The diagram includes a circular feedback loop between the process and growth stages, suggesting iterative improvement. The sequence concludes with an ascending bar chart, symbolizing successful business growth and increasing revenue.
Коллекция по умолчанию
Коллекция по умолчанию
Создать новую

Businessmen miniature figure standing on investment and profit graph for analysis and discussion.
Коллекция по умолчанию
Коллекция по умолчанию
Создать новую
Monthly percentage bar chart showing financial comparison of 2026 budget versus actual performance data displayed on digital screen. Results tracking.
Коллекция по умолчанию
Коллекция по умолчанию
Создать новую

Wood block stacking as step stair. On green background. Business concept for growth success process.
Коллекция по умолчанию
Коллекция по умолчанию
Создать новую

Office laptop business financial document chart and graph on wooden table with coffee cup. Flat lay notebook computer laptop on office desk. No people business graph chart mockup on business workspace
Коллекция по умолчанию
Коллекция по умолчанию
Создать новую
business documents over papers with numbers and charts. View from above
Коллекция по умолчанию
Коллекция по умолчанию
Создать новую

Growing word progress. Personal development and business growth.
Коллекция по умолчанию
Коллекция по умолчанию
Создать новую

Wooden block business growth with arrow up. Business growth rates, creative ideas graph business development to grow profit and success for target concept.
Коллекция по умолчанию
Коллекция по умолчанию
Создать новую

A close-up of a business report with colorful bar and line graphs.
Коллекция по умолчанию
Коллекция по умолчанию
Создать новую

cork it post
Коллекция по умолчанию
Коллекция по умолчанию
Создать новую
An office worker shows his colleagues a presentation with a company development graph at night on the company's computer
Коллекция по умолчанию
Коллекция по умолчанию
Создать новую

colorful, five rainbow colored sponges on blue background
Коллекция по умолчанию
Коллекция по умолчанию
Создать новую

A medium shot shows a hand placing a small, red flag icon on a miniature, intricately detailed process flow chart laid out on a wooden desk
Коллекция по умолчанию
Коллекция по умолчанию
Создать новую
Coronavirus virus covid-19 chart, crisis, economy down, 2019-ncov graph epidemic
Коллекция по умолчанию
Коллекция по умолчанию
Создать новую

Close up image of a flowchart showing various steps of a process, representing workflow, stages, and methodology.
Коллекция по умолчанию
Коллекция по умолчанию
Создать новую

A stock market graph on a black background.
Коллекция по умолчанию
Коллекция по умолчанию
Создать новую
Businessman holding a chess figure of king to climb up the steps of business success and vision.
Коллекция по умолчанию
Коллекция по умолчанию
Создать новую

This image features colorful wooden blocks arranged in ascending order, representing growth and analysis in business metrics and statistics. Perfect for visualizing progress.
Коллекция по умолчанию
Коллекция по умолчанию
Создать новую
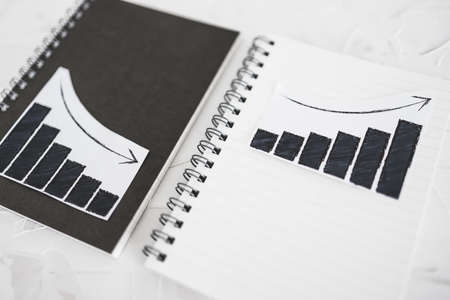
business analysis and statistics concept, positive and negative trends on graphs on notebooks side by side
Коллекция по умолчанию
Коллекция по умолчанию
Создать новую

Wooden tiles form a stairway with copy space on a black background
Коллекция по умолчанию
Коллекция по умолчанию
Создать новую

Small team working together with business reports
Коллекция по умолчанию
Коллекция по умолчанию
Создать новую

A detailed bar graph display featuring colorful sticky notes that illustrates data analytics in a modern office setting, symbolizing creativity and strategic planning.
Коллекция по умолчанию
Коллекция по умолчанию
Создать новую

ballpoint pen indicates income graphs lying on the table
Коллекция по умолчанию
Коллекция по умолчанию
Создать новую
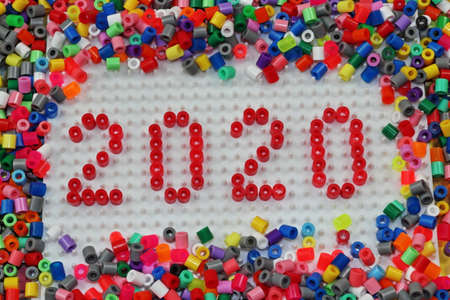
2020 written in red numbers with white background using Hama beads,
Коллекция по умолчанию
Коллекция по умолчанию
Создать новую

A vibrant collection of sticky notes and papers arranged on a wooden table showcases a collaborative brainstorming session in a contemporary office. Hands actively engage.
Коллекция по умолчанию
Коллекция по умолчанию
Создать новую
Five ways to take the first step of your journey to success in life and business.
Коллекция по умолчанию
Коллекция по умолчанию
Создать новую

climbing ladder of success step by step concept with wooden blocks
Коллекция по умолчанию
Коллекция по умолчанию
Создать новую

Wooden Blocks Connected in a Network Showing Various Technology Icons, generative Ai
Коллекция по умолчанию
Коллекция по умолчанию
Создать новую

Conceptual image of stock market and economy growth - graph with upward pointing arrows.
Коллекция по умолчанию
Коллекция по умолчанию
Создать новую

Policy, Procedure, Protocols, Process write on a book isolated on the table.
Коллекция по умолчанию
Коллекция по умолчанию
Создать новую

Notebook work with statistics on the table
Коллекция по умолчанию
Коллекция по умолчанию
Создать новую

Charts and graphs display data insights on a table, while vibrant holiday ornaments add a festive touch to the workspace, creating a cheerful atmosphere.
Коллекция по умолчанию
Коллекция по умолчанию
Создать новую

A creative pie chart with textured segments showing sales data, each slice representing a different product line, set against a rustic wooden table background.
Коллекция по умолчанию
Коллекция по умолчанию
Создать новую
many sheets of documentation lying on the table.
Коллекция по умолчанию
Коллекция по умолчанию
Создать новую
Business reports
Коллекция по умолчанию
Коллекция по умолчанию
Создать новую

Close up making agenda Daily schedule on personal organizer. Business and entrepreneur concept. Isolated on a black background
Коллекция по умолчанию
Коллекция по умолчанию
Создать новую
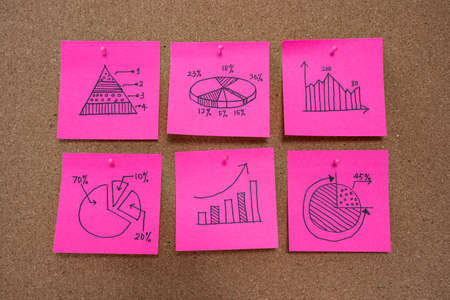
Different business graph charts on pink sticky notes for business planning and analysis
Коллекция по умолчанию
Коллекция по умолчанию
Создать новую
Legion-Media
Создайте свои проекты на основе качественных стоковых фотографий и видео.


Copyright © Legion-Media.